Today I want to share with you how we start shopping online and end up sending more than our estimate. Suppose you have decided to purchase a new mobile. The first thing we do is cost comparison of two e-commerce sites. We will choose the cheaper one, but with the mobile we will buy the additional charger, case, screen guard, etc right. You may these are the things you eventually buy right. You're right but here is magic.
If we deeply analyze everything except the cost of mobile, the remaining items will be cheaper when compared to other websites, Yes technically it is called Loss Leader.
These are the techniques used in E-Commerce using analysis. Let me start from the questions.
What is E-Commerce Analytics?
Ecommerce analytics is the process of gathering data from all areas that have an impact on your online store and using this information to understand the trends and the shift in consumers’ behavior to make data-driven decisions that will drive more online sales.

Use Cases in ECommerce Analytics
Descriptive Analytics: Descriptive analytics is the interpretation of historical data to better understand changes that have occurred in a business. Descriptive analytics describes the use of a range of historic data to draw comparisons. Most commonly reported financial metrics are a product of descriptive analytics, for example, year-over-year pricing changes, month-over-month sales growth, the number of users, or the total revenue per subscriber. These measures all describe what has occurred in a business during a set period. In Short, Asking what happened? We will answer to the questions like, What is the age group of our best customers? What is the graph of our sales, any reason why we are doing bad in some regions? Any changes need to be made on marketing?
Customer Segmentation:

Customer segmentation is the practice of dividing a company's customers into groups that reflect similarity among customers in each group. The goal of segmenting customers is to decide how to relate to customers in each segment in order to maximize the value of each customer to the business.
Forecasting sales: A Sales forecast is a prediction of future sales revenue. Sales forecasts are usually based on historical data, industry trends, and the status of current sales. Businesses use sales forecasts to estimate weekly, monthly, quarterly and annual sales.
Just like weather forecasting, the team should view the sales forecasts as an action plan.
Sales forecasting is different from sales goal setting. While the sales goal describes what you want to achieve, a sales forecast estimates what might happen, regardless of goal.
Benefits:
- Provides forecasts for raw materials.
- Easy risk management and business planning
- Managing cash flow.
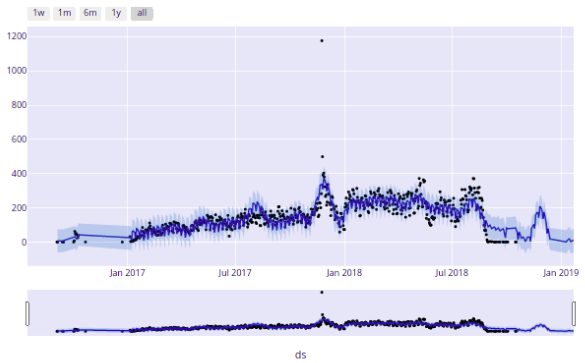
Here we are forecasting the sales of next quarter.

Market Basket Analysis:

Market Basket Analysis is one of the key techniques used by large retailers to uncover associations between items. It works by looking for combinations of items that occur together frequently in transactions. To put it another way, it allows retailers to identify relationships between the items that people buy.
Benefits:
- Customize Promotions.
- Set the right prices.
- Helps in recommending products.
Recommendations: As we all know what recommendations are, let's talk about the reasons why we want recommendations.
Reasons for recommending:
- Better User Experience.
- Sales Boost.
- Customer Engagement.
- More Traffic.
Analysis on E-Commerce data
Here we are trying to help a company by giving insights from its data.
We have Customer data, Seller data, Orders data which talks about the customer, seller and the orders.
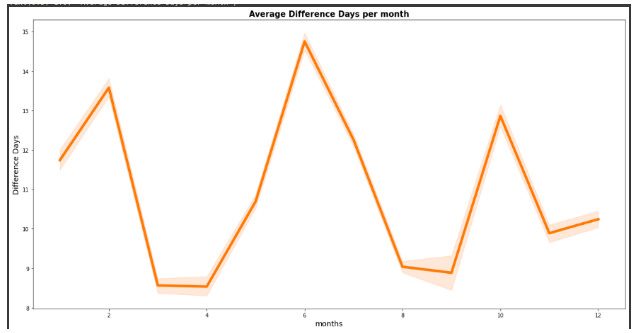
The above graph shows the difference between the [order estimate date] - [ Order delivery date ], which represents there are no late deliveries.
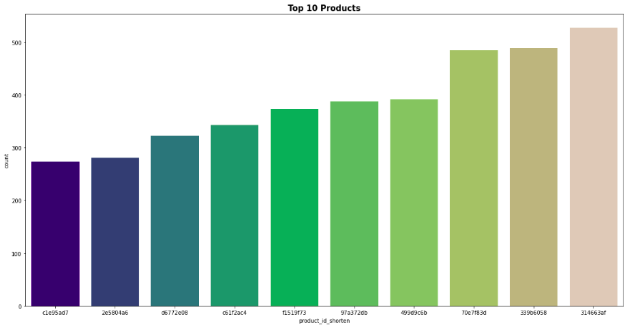
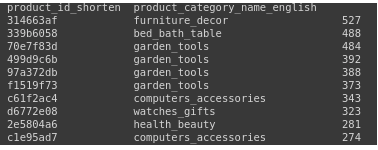
Let me show the Top 10 Products ordered.
Top 10 product categories
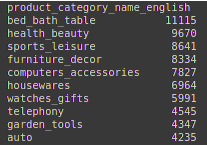
Product wise Product Category
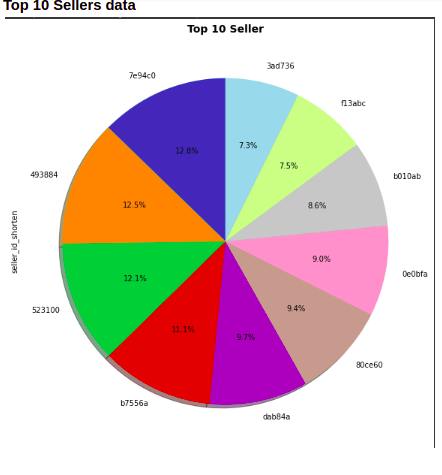
Top 10 Sellers data
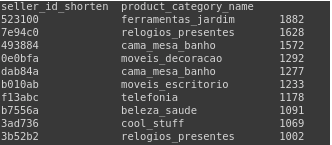
Highest sold products by seller:
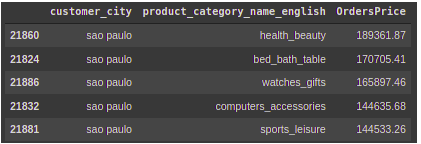
Sao Paulo is Highest Revenue generated city based on Order Value:
Forecasting:
Fbprophet: Prophet is a procedure for forecasting time series data based on an additive model where non-linear trends are fit with yearly, weekly, and daily seasonality, plus holiday effects. It works best with time series that have strong seasonal effects and several seasons of historical data. Prophet is robust to missing data and shifts in the trend, and typically handles outliers well.
- It is Accurate and Fast
- Fully automatic
Here we are trying to predict the future orders by forecasting.
